

tiedot is an initiative of Rod Jager Consulting, created to support and empower users of selected business intelligence and database technologies.
This site shares curated intellectual property, including scripts, templates, and guidance, designed to help you get more from your BI and data solutions.
All materials are provided as is, where is, with no warranties or guarantees. Use them at your own discretion to accelerate learning, experimentation, and implementation.
This post is getting into the systems management side in that it puts forward a naming convention for tasks in the Qlik Sense Management Console (QMC).
Where task management becomes more complex is if there are a lot of reload tasks or relationships between tasks such as dependant task triggers.

In this post two worlds collide as the topic is on using data from Planning Analytics (TM1) as a data source for Qlik.
Conditionally coloured up/down arrows, independent of your primary KPI value are possible in the Qlik Sense KPI objects and this is one of those really nice touches that adds another dimension in terms of using shapes and colours to simplify understanding metrics.
Sometimes it makes more sense to use a QVD to load your data from than the source. This might be for testing, performance or development reasons or maybe just because the day ends with a ‘y’.
This script is an example of how to loop through all of the tables in a data model and create a series of QVDs. There is an optional variable (vDebug) you can use to trigger whether this works.
The script should be placed after all the other processing eg on the last Tab or Section.
Data comes in all shapes and sizes and sometimes, the users of the data want to see this as a series of metrics eg as key performance indicators. As always, there are not of ways of handling this and for a quick way in Qlik Sense you can use some generic logic to build a KPI data set that you can keep expanding.
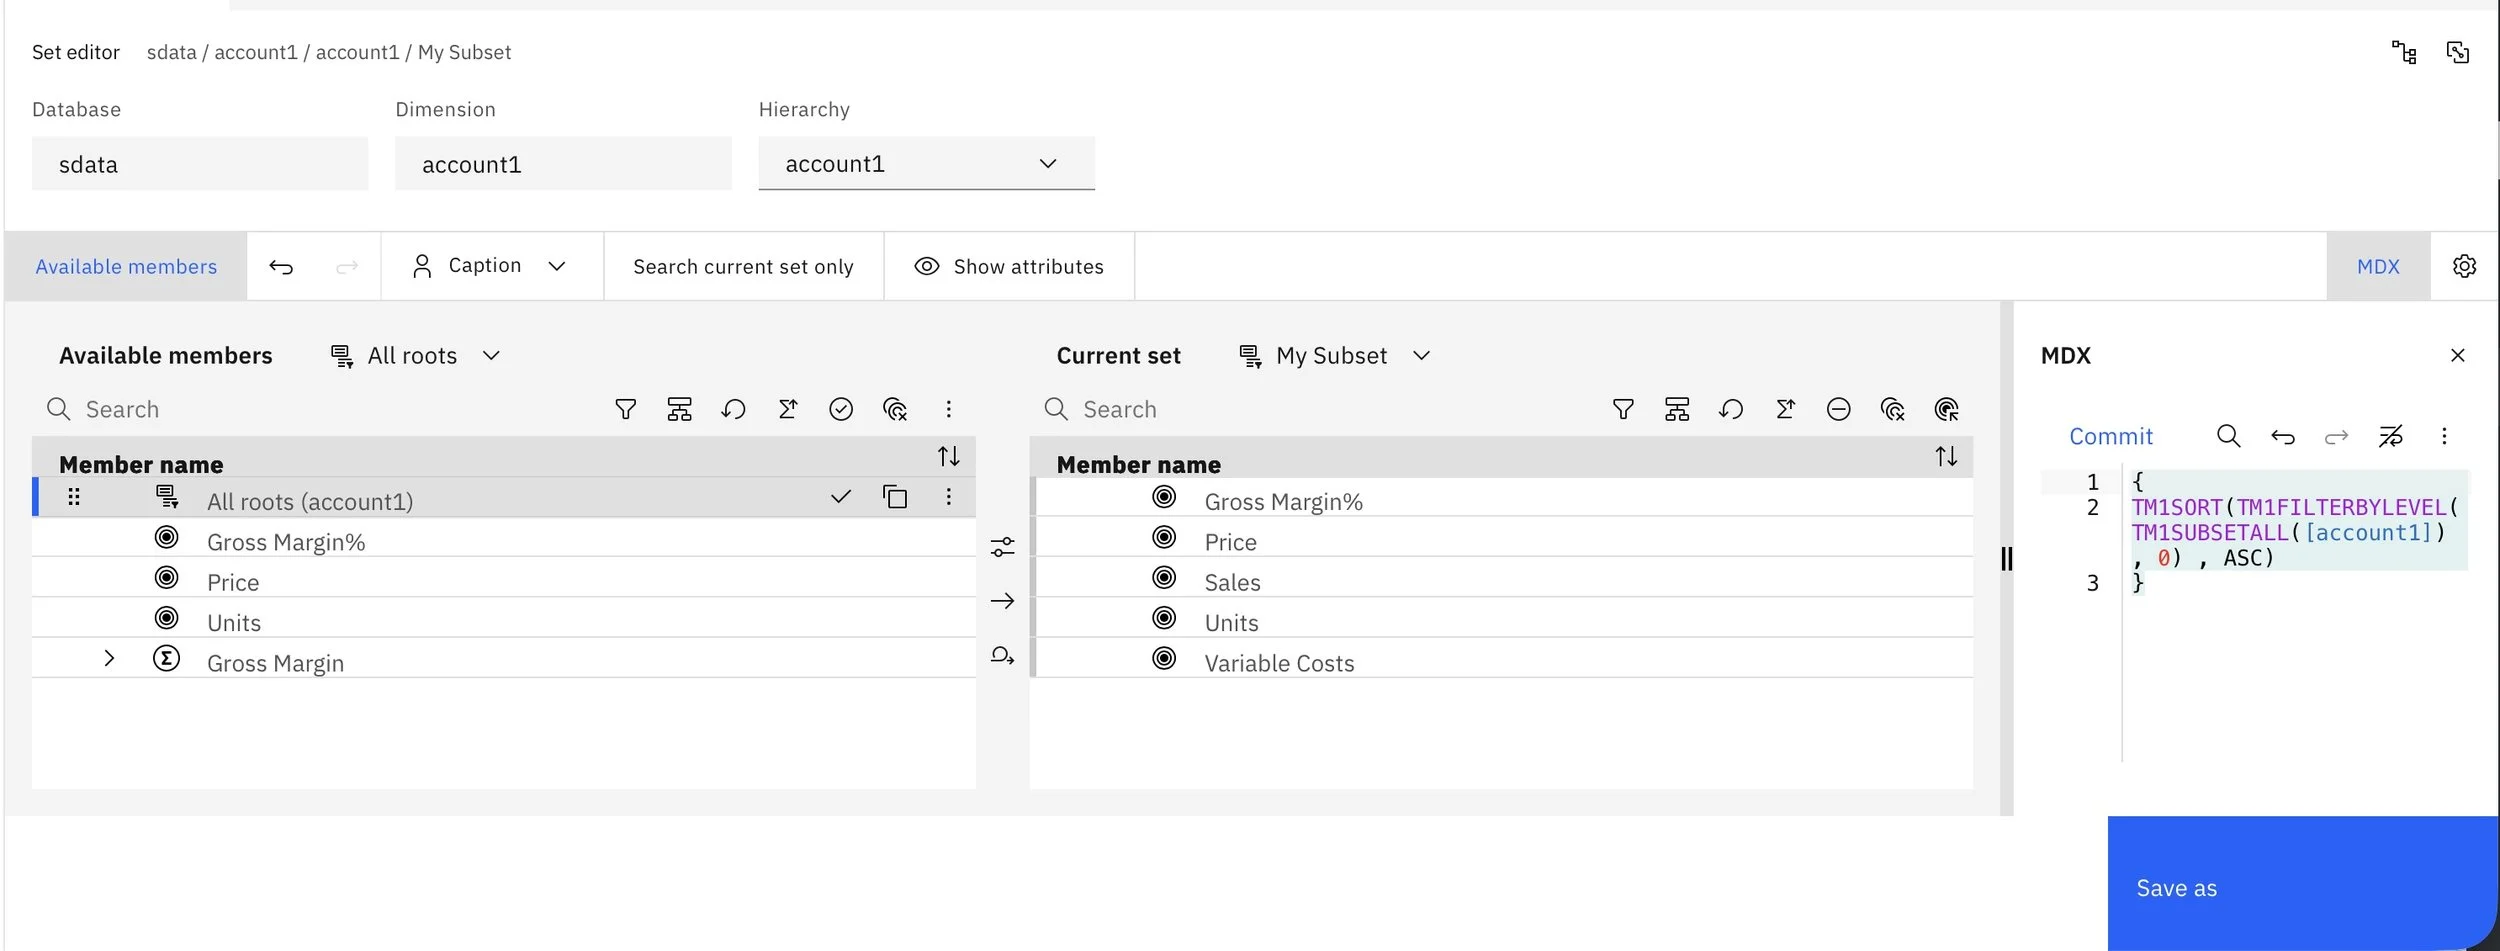
Subsets (sets) in Planning Analytics are an analysts friend and one of the simplest ones is the all leaf (aka level 0 / all N/S) elements variety.
For example, you can use this to build a trial balances for a finance model, generate a stocktake summary for an inventory model and more.
This post demonstrates how relatively simple it is to enhance the capabilities of TM1 with AI infused natural language query (NLQ) to assist with interpreting your data using Python with TM1.
Examples like this using NLQ support a broader (non technical) user base and help to transform the activity focus from lower value information collation to higher value data analysis.
This example demonstrates one (of many) methods for using an opening balance rule to roll forward balances between financial years using some of the calendar capabilities detailed in previous posts.
Have you ever forgotten to roll over your date related subsets or would you like them to automatically roll with the punches dates?
In yet another date related post, this time the focus is on creating dynamic subsets for a year and month dimension by leveraging the calendar cube from a previous post.
Extending from the last post on incrementing dates in Planning Analytics (TM1), this post looks at how to build a simple Master Calendar cube that can be leveraged in rules and TurboIntegrator (TI) processes.
These examples demonstrate how, in TurboIntegrator and rules notation, dates can be incremented by years, months or days.

This article demonstrates how to use native functionality in Power BI to extract data from Planning Analytics (TM1) via the API using a public cube view as the source.
One of the neat features in Power BI is the ability for a user to create a calculation at any of the modelling tiers. This example is aimed at the end user who wants to add a dynamic calculation, in this case to calculate an average sale price using a combination of Amount and Quantity.
This example demonstrates a method for creating a variance (Budget - Actual) between existing data points.
This is a code block, entered through the query editor, that will give you a timestamp for the last time a Power BI data set was refreshed.
This example is a block of code to create a calculated table in Power BI to generate a calendar based on a date field